Measuring Your Results
Chapter 9

With your first email campaign out the door and starting to receive opens and clicks from your subscribers, you’ll be able to begin tracking the success of your email marketing efforts.
The two best places to track the success of your email marketing campaigns are your email marketing tool and your website analytics tool (such as Google Analytics).
The analytics section of your email marketing tool is the place to go to understand how people interact with your email campaigns and is a goldmine of insight and untapped opportunities.
Besides the total number of email subscribers you have (and how much more you’re getting), you should be looking at the following key email marketing metrics:
- Open Rate: The percentage of subscribers who opened your email.
- Bounce Rate: The percentage of emails failing to make it into a subscriber’s inbox.
- Click-Through Rate: The percentage of subscribers clicking a link in your email. By using a URL shortener like Rebrandly you can easily track the clicks of your links and understand where they are coming from.
- Unsubscribe Rate: The percentage of subscribers “opting-out” or unsubscribing from your email list.
Your open rate will tell you how well you’ve nurtured your relationship.
If the percentage is low, it means your subscribers have started to delete your emails upon receipt, which means you need to do a better job providing value and managing expectations.
If your bounce rate is high, you need to determine if it’s due to a technical/server error or the fact a subscriber’s email is no longer active.
If your click-through rate is low, it means your emails are either not targeted enough, or your communication efforts are slipping through the cracks. In this case, focus on improving your copy and calls-to-action.
And last of all, if your unsubscribe rate is high, then you’ve got some serious work to do…
If this is you, try to pinpoint when people are unsubscribing and take action to plug those leaks.
- If they’re leaving after a specific autoresponder email, then re-work it.
- If they’re leaving after promotional emails, then re-work the way you present offers.
- And if they’re leaving early on in your funnel, then you need to fix your original opt-in form so it’s in sync with what you’re sending.
All in all, these four metrics will give you a high-level overview of how your subscribers are interacting with your email campaigns and allow you to compare the success of one campaign to another.
And while most small businesses focus on optimizing open rates, it’s important to remember the ultimate goal of your emails is to drive your subscribers to take a specific action.
This can take shape in the form of booking a service, leaving a review on your Facebook page, or reading your latest blog post.
Your focus is to encourage subscribers that do open your emails, to click the links in them.
So you’ll want to prioritize your click-through rate as the first email marketing metric to improve.
Beyond Email Analytics
Once you’ve spent some time digging into your email analytics, it’s time to kick it up a notch and look at what happened after they clicked through to your website.
This means you need to have a web analytics tool (like Google Analytics) installed on your website.
Once Google Analytics is up and running on your website, one of the first things you can do is track how well specific links in your emails are performing.
To do this, you’ll want to use UTM parameters, which help Google track specific links and gives you more insight into how users navigate your content.
You can also begin to track what percentage of your traffic is opting into your email list. This insight will allow you to see what type of traffic is converting best and where visitors are converting.
For example, traffic that found your website through Facebook tends to opt-in to your email list the most.
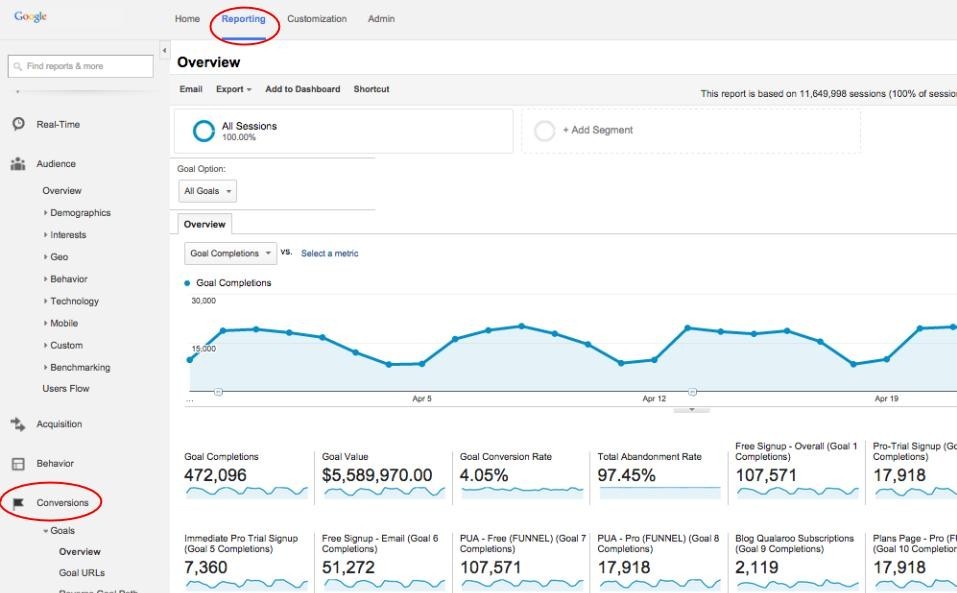
Then, under the Reporting tab in Google Analytics, navigate to Conversions, Goals, and Overview (pictured above).
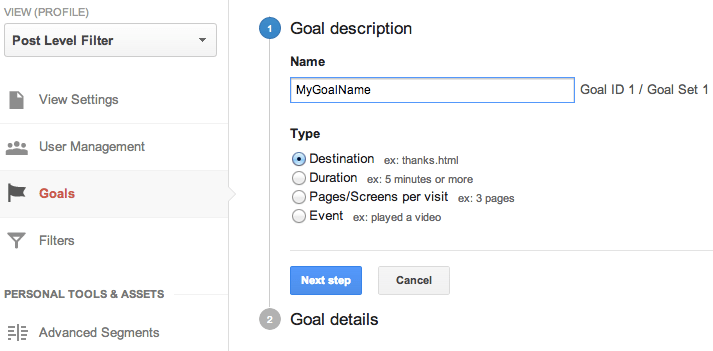
To create a goal:
- Sign in to your Google Analytics account.
- Click Admin, and navigate to the desired view.
- In the VIEW column, click on Goals.
- Then click on “+ NEW GOAL” or “Import from Gallery” to create a brand new goal, or click an existing goal to edit it.
Creating your first goal is very easy. Simply give your goal a name, leave the Goal slot ID as the default, and for Type, choose Destination. Then click Next Step.
From there, under Goal details, you will only need to fill out the Destination field. This will be the URL of your “thank you” page, or the page the visitor is redirected to after signing up for your email list.
This won’t be the full URL. So if the URL of your thank you page is https://gorilladesk.com/thankyou/, you will only enter /thankyou/ into this field.
All other settings and fields can be left blank or as the default.
Note: assigning a value or enabling the funnel is not necessary to track email list sign-ups.
Once you finish these steps, you are now actively tracking your email list opt-ins.
To keep an eye on how well your list building efforts are going, navigate to the Reporting tab, and look under Conversions and Goals in the left menu.
